Morris, 2018. 29.07.13 from Jo-Ana
As an online exhibition, Jo-Ana has an advantage which is denied to its physical counterparts.
Whilst physical exhibitions can be advertised and subsequently read about on social media, they still require a journey to go and see the works of art. In Jo-Ana’s case, however, one click and you are immediately transported to the exhibition as the images appear on the screen within seconds.
Not all social media channels are appropriate for all causes. The three social media channels which were chosen to market Jo-Ana were Facebook, Instagram and Twitter.
There are issues to be overcome in getting images from a laptop into an Instagram account. However, once images are posted to Facebook it is an easy task to share them externally on other social media platforms, Instagram included.
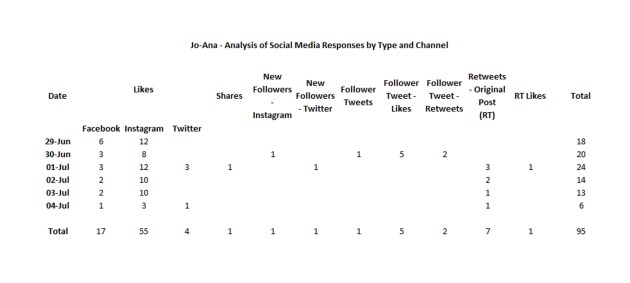
Facebook generated the least interest – this was predicted (this accuracy is viewed positively as it demonstrates an understanding of the target audience and its behaviour). Instagram generated the most, with Twitter coming second. Again, this was expected. The Instagram account was established in October 2017 and had a small following, but a following nevertheless and one that is loyal. The Twitter account, on the other hand was set up immediately before the launch of the Jo-Ana exhibition and has only attracted a small number of followers which, again, appear to be loyal.
Hashtags were researched, looking at posts made by recovering anorexics to see which hashtags had the highest frequency of use – using these in the advertising posts for Jo-Ana would help give maximum reach
The campaign has been successful, there has been a definite response. The response appears to show a split result.
The first target group, friends, family and colleagues of anorexics arrive at Jo-Ana through direct referral.
The second target group, anorexics (both those recovering and those not) arrive at Jo-Ana through social media channels. This group also responds to adverts for Jo-Ana on social media channels – this response taking the form of likes, comments, shares, or retweets.
Detailed analysis of all social media response over an initial data capturing period of 6 days can be seen below.
One thing is clear, response is proportional to the number of followers an account has, irrespective of hashtags.
Next steps are to analyse other contemporary practitioners and peers in order to establish what they do that is different and leads to success in terms of organic growth of followers.
Google Analytics is being used to monitor traffic to the website. At the time of writing (22 July 2018) the exhibition has received 123 views since being launched on 29 June.
 Jo-Ana – Analysis of Social Media Responses 1, July 2018
Jo-Ana – Analysis of Social Media Responses 2, July 2018
